FAA Warns on Runway Length Data and Overrun Risk

On Jan 21, the FAA issued a new Information Note for Operators after identifying cases where incorrect runway length data was being used for performance planning.

The concern is straightforward. Using the wrong numbers can skew takeoff or landing calculations, which is why the FAA says performance planning should be based on declared distances from the Chart Supplement.

What exactly is the issue?

The FAA notes that many crews default to runway lengths taken from airport diagrams, charts, FMS databases or commercial planning tools.

The issue is that these sources may not include declared distances (TORA, TODA, ASDA and LDA) which are the figures used to meet regulatory performance requirements and can differ significantly from the physical runway length.

The FAA’s concern is that crews may misunderstand declared distances, omit them entirely, or rely on FMS or third-party data that has not been updated after changes.

So a quick clarification on how runway lengths are defined helps…

About runways

When we talk about default runway length, we are talking about the physical length of the runway surface. It’s what you see on charts, airport diagrams and other sources of info.

It represents exactly that – pavement from end to end. It may include unusable bits (such as displaced thresholds, closed portions etc) and is often a single number with no context.

It doesn’t tell you how much runway is legally available for takeoff or landing and can significantly overstate what you can actually use (more on that later).

Declared distances, on the other hand, are the official, performance-relevant runway lengths published by the airport authority via the FAA Chart Supplement and other validated sources.

A brief reminder of what these distances include (and critically, don’t):

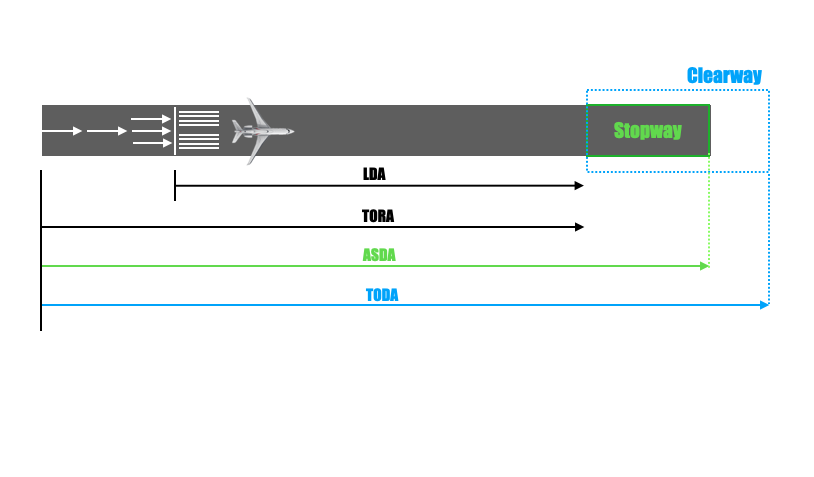
Takeoff Run Available (TORA). Think of this as how much runway you can accelerate on. It includes useable pavement only, starting at the take-off threshold. It doesn’t include clearways or stopways.

Takeoff Distance Available (TODA). How much distance you have to get airborne (i.e. TORA) plus the distance required to clear obstacles in the initial climb segment (clearways). Crucially, it doesn’t include stopways (usable in a rejected takeoff).

Accelerate-Stop Distance Available (ASDA). Think of this of how much distance you have if you reject the takeoff. It includes TORA and stopways. It doesn’t include clearways.

Landing Distance Available (LDA). How much runway you actually have to stop after touchdown. This includes usable pavement from the landing threshold to the end of the runway. It doesn’t include pavement before a displaced threshold, stopways or clearways.

Here’s what this all looks like:

Under the FAA regs, these distances are the authoritative performance numbers. They override any single runway length shown elsewhere. That’s the key point.

Real world example

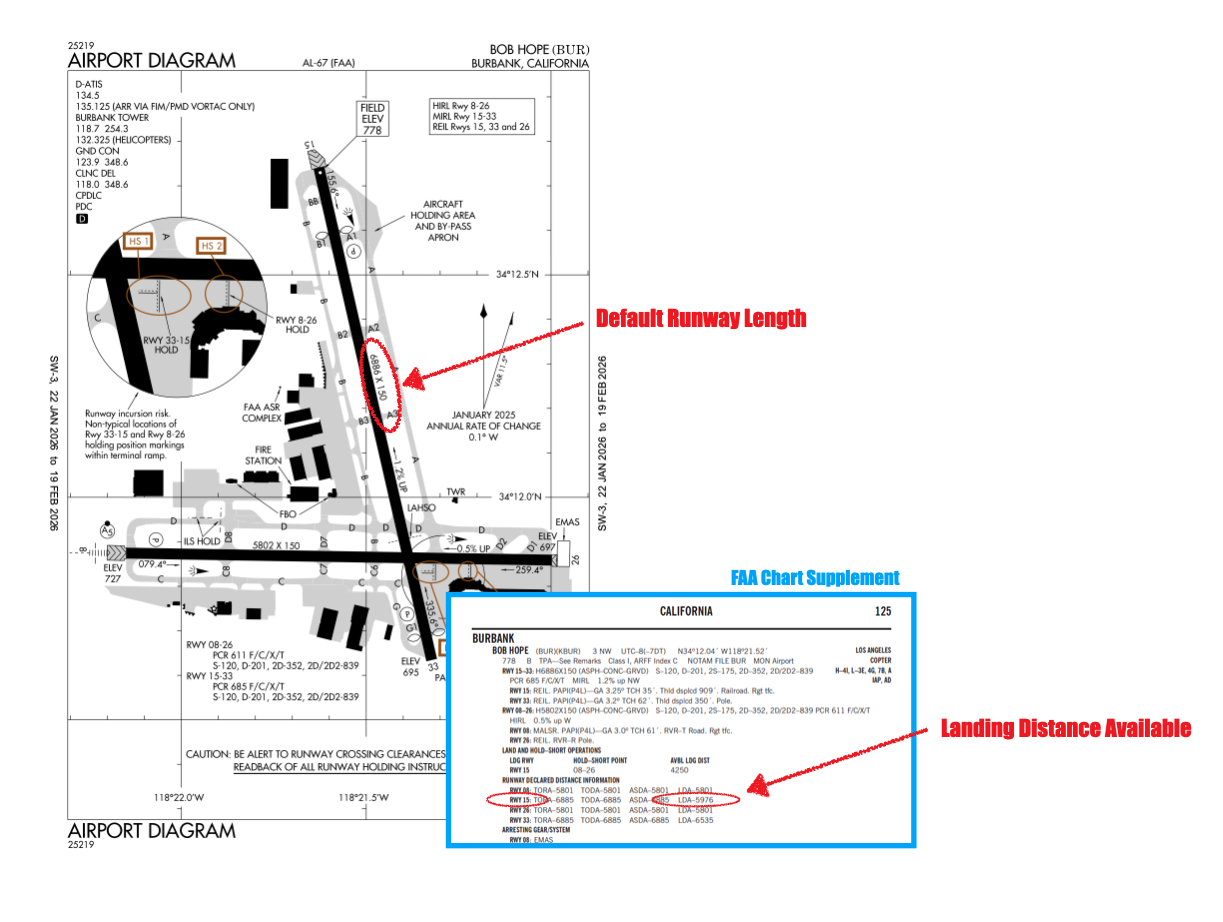
But that’s enough theory. A good real-world example is KBUR/Burbank Runway 15, where the published runway length and the declared landing distance are not the same.

Many charts and planning tools show a runway length of 6,886 ft. But the FAA Chart Supplement lists an LDA of 5,976 ft due to a displaced threshold for obstacle clearance.

If crews plan landing performance using the longer figure, they may be overestimating available runway by about 900 ft. Add tailwind, a wet surface, or a performance-limiting MEL, and that margin can disappear quickly.

That’s exactly the scenario the FAA is trying to prevent.

So what’s the FAA’s advice?

For performance calcs, the FAA says crews should use published declared distances, not the physical runway length. Just because pavement exists doesn’t mean it’s legally usable.

That expectation needs to be reflected in procedures, training and day-to-day practice.

Crews also need to be clear on which runway lengths their performance tools are actually using.

Be aware that the FMS runway length is not LDA, ASDA or TODA.

Operators should also review FMS databases and third-party performance tools, understand their limitations, and check that the data is current.

Have you spotted something risky out there?

Share it (anonymously) with the group! You can reach us via blog@ops.group, Airport Spy or Report-A-Thing.


Feeling the Heat

It’s getting hot outside. Actually scrap that, it already is hot out, and in some places it’s getting even hotter! Which means our poor little airplanes are suffering, struggling, sweating their little airplane socks off.

We’ve written up some bits on this before, and you know it all already – watch the temperatures, watch the performance, watch the climb gradients, watch the big old storms puffing up around hot spots.

If you want a full recap then you can read that all here.

Here’s a quick refresher.

A swig of cool lemonade for the pilot brain…

  • Planning: Make sure you’re not at risk of heading outside the operating envelope.
  • MELs: Check the APU, the packs, basically anything that produces cold air because if there are problems there, you might need to think about your crew, passengers and freight too.
  • Engines: Keep an eye on them, particularly during start.
  • Brakes: Watch them brake temps. Plan the taxi, and think about how best to brake to keep them as cool as you can.
  • Fuel: It has hot limits as well as cold limits.
  • Performance: Yup, hot = not so dense = not so good.
  • Climb: Hot, high, heavy? You might not meet those restrictions and it’s better knowing that before you go than trying to drag your airplane up over stuff.
  • Approach and Landing: Turbulence from thermals can get testing.

And here are some pointers on the really ‘scorching’ issues…

Batteries.

The one in your airplane is fixed so not much you can do about it other than turn the APU on/ plug in some cold air tubes or push your airplane into a shady hanger. But all the other removable bits filled with Lithium Ion batteries are worth considering.

Things like your Defibrillators for example. These usually have max temperatures (50 degrees rings a bell) so you may find you need to move them, remove them, take them off with you overnight.

Cargo

Passengers can complain and you can throw water on them. Cargo less so. 

A sad result of excessive heat at KMIA/Miami airport was the death of thousands of baby chicks recently. Whilst air temperature might be reading ok, asphalt can be 40-60 degrees F hotter than the air around it.

Storms

Hot weather means storms. If you see something in front of you, or on the weather radar, be careful about going over the top – if they are building then you’re going to meet some pretty rough air up there if you aren’t well clear.

A general recommendation is 5000’ for big’uns.

Then there are tornadoes.

Actually, the number of days each year that see tornado activity has fallen, but the number of mega outbreaks (30 or more in a day), the density of clusters and the general strength have gone up. So 3:1 to tornadoes really.

NOAA has a tornado watch page that is worth watching (checking out during the season).

The National Weather Service Twitter account is also a good spot for live updates.

They can be hard to predict, but do cause disruptions if they are near airports (not to mention potential damage). Texas is the most hit state, but there have been numerous warnings and watches out across the US including Pennsylvania, Ohio of late.

And then there are fires.

Wildfires are cropping up across the US. This site is good for monitoring these.

The risk of fires to aviation is less burning destruction, and more smoky ash visibility reduction. They can also create a secondary risk from increased airborne firefighting traffic in the areas.

Europe has seen a big increase in serious wildfires this this year, with the Mediterranean area particularly badly affected. Portugal, Spain, Greece, Italy, Croatia – all burning to varying degrees. This may cause some inflight disruption, and may cause parking issues and ground disruption particularly at smaller airports.

Humidity

This is for you and your passengers. 

India in particular has been hitting the ‘wet-bulb’ limit for human survival. Sounds doomsdayish? Well, it can be.

The wet-bulb temperature is basically what you get if you wrap a water soaked cloth around a thermometer. If this exceeds around 35 degrees C then that’t the time to really start sweating, so to speak, because above this we actually become unable to reduce our body temperature even by sweating, sitting in the shade, or drinking water. Prolonged exposure to this will result in potentially fatal heatstroke.

So keep an eye on the temperature, the dew point, and any staff you have outside!

Environmental stuff.

The real reason I wrote this post…

It was so hot in England (yes, England!) that EGGW/Luton airport’s runway melted. OK, melted might be an exaggeration, but a chunk of asphalt shifted and caused a lot of disruption for a day, and it was only only 37 degrees C.

EGVN/Brize Norton experienced a similar problem.

Airports, or rather the folk who manage them, in the likes of Dubai and the Middle East are used to these temperatures and what it can do to asphalt, which is probably why they regularly overhaul them. But places less familiar with soaring temperatures aren’t.

Watching those Notams is the best advice for this.

Keep an eye on airports in countries with less infrastructure as well. Again, India has been struggling with power cuts and blackouts due to extreme temperature and this may well impact airports just as much.

Climate change?

Here is something Eurocontrol said about it all. Don’t worry, it’s not a “what to do about it” lecture, but more “things to look out for because of it” guidance.


Safety on the NAT: B+ with room for improvement

The eighth Annual Safety Report for the North Atlantic Region is out, and it looks good. A solid B+ for pilots and ATC alike.

But there is still room for performance improvement, so here are the highlights from the report to focus on.

Did anyone fly in 2020?

The number of flight hours in the NAT HLA through 2020 was 892,137 which was unsurprisingly a decrease on the 2019 hours (2,063,908 in case you’re wondering).

The peak week was July 15-21 when it saw 5,621 flights crossing, compared to 13,733 for the peak week of 2019.

If you want to check and compare all the stats to 2019 then here is our post on that.

What have they been monitoring?

Safety Performance in the NAT HLA is monitored and measured in 12 areas. The targets for 6 of these were achieved in 2019, while 2020 achieved an impressive 8.

The biggest improvements seem to be:

  • Less Large Height Deviations where Datalink was not in use
  • A reduction in the amount of time aircraft with datalink spent at the wrong flight level
  • A reduction in the number of GNE events involving aircraft with datalink

How likely are you to fly into someone else?

Much of the safety focus in the NAT really boils down to this – it is an area of reduced separation and high density traffic. So, they also worked out the risk of collision and in 2020 it reduced by 74%, which is probably down to less aircraft but also to less mess-ups. 

SLOP is one of the main factors in reducing this number. And it doesn’t just reduce the risk of collision, it reduces your risk of running into wake turbulence as well. So keep up that slopping, up to 2nm right (and 0.1nm increments).

Who’s to blame for the times it did go wrong?

Ok, ok, the purpose of the report is not to point fingers, but to understand where improvements can be made.

The Top 10 factors in errors haven’t really changed – ATC coordination errors are top, closely followed by “crew other” (which pretty much means crew not doing what they’re told, messing up etc) and then interestingly application of contingency (other than weather).

So here is a quick recap on those Contingency Procedures to follow

Some facts and figures

Since 2019, 70% of core NAT traffic has been using ADS-B.

There have been no accidents in the NAT since at least 2017. 2020 also saw no losses of lateral separation for the first time since 2017.

They did see 47 LHDs, 57 Lateral Deviations (15 were GNEs, the other 13 were caught and corrected by ATC), 26 coordination events, 1 longitudinal loss of separation and 30 events they prevented where someone was basically just flying the wrong flight profile.

18% of events were down to ATC coordination between different ATC sectors.

18% also came down to fight plan versus clearance issues.

11% were weather related. 

Issues with dispatch contributed another 8% and everything else was down to, well, lots of other things.

How can we improve?

Follow the Golden Rules of operating in the NAT HLA:

  • Have the Right Equipment: If you ain’t sure then check out our Circle of Entry.
  • Have a Clearance: If you can’t get it on CPDLC then have those HF or VHF frequencies ready for a voice clearance, and make sure you read it back and confirm it correctly.
  • Check your Route: This means flying what you’ve actually been told to fly which means checking what is in the airplane box matches what is in the clearance. It probably should say ‘flight profile’ because it means route, altitude and speed.
  • Know your Contingencies: We added the picture above to help. Read more about this here.

And don’t forget to SLOP.

Keep up to date on NAT info

Photo @Algkalv from Wikimedia Commons


The Seven Deadly Things

Have you ever taken a look at a report listing the distribution of Accidents by Accident Category? There are apparently more than 40 possible ways an accident can be categorized, but there are 7 that seem to pop up way more often than any other.

Airbus took a look into all fatal and hull loss accidents which occurred between 2009 and 2019 and the results are shocking in that a lot of those accidents just should not have happened.

P is for…

Yep, pilots. We are a big problem. We mess up a lot. That is what seems to be said in the media anyway…

But, it isn’t always our fault, (sadly some of the time it also is), and we all know that the news reporter’s favorite phrase “pilot error” (or “human error” if they are feeling particularly generous about it) is rather meaningless, and very unfair.  It removes all the context of the why’s and the how’s of what led to a pilot making an error, and it is rarely ever as simple as “they just messed it up.”

There are usually countless small things that lead up to any incident, and many a CRM course has been spent discussing and brainstorming how we can better avoid all of these little things and so avoid it ending up in a “one big thing” event.

So, why are these big events still happening? And what can the pilot in the equation do to prevent them? (Because the vast majority of these definitely are preventable).

1. Loss Of Control In Flight

This is the single biggest cause of fatal airplane accidents in this period, accounting for a scary 33%, and 12% of hull losses. We are not talking about situations where something major has broken or failed – we are talking about times where aircraft have somehow managed to get into a situation they shouldn’t be in, and the crew have not able to safely get them out of said situation.

Air France Flight 447 is one of the most discussed examples of this occurring.

All these accidents no doubt had other factors involved – it was not just the pilots not knowing how to fly. There were things like startle factor, bad weather, other warnings, other traffic…

But a large number of these could have and should have been recoverable.

So, what can we do about this? Well, ICAO took an in-depth look at why these kept happening, and they came up with a great and simple thing – UPRT. 

Upset Recovery and Prevention Training

When they say simple they really mean it – all you really need to know is PUSH, ROLL, POWER, STABILISE (and maybe have had a few practice goes in the sim).

This is the recovery though. It is the point when everything has gone wrong and all you have left is fixing it.

Luckily, we pilots do have a few other tools in our toolbox which we can pull out earlier at a time when prevention might still be possible. Things like good monitoring, situational awareness, an understanding of startle factor.

In fact, we have a post right here if you’re up for some more reading on the old startle thing.

There is also that Other thing we can do. It might be one that makes a few palms get a little sweaty at the thought of it – but we can disconnect the autopilot and actually hand-fly now and then.

2. Controlled Flight Into Terrain

Second on the list of the ‘7 Deadly Things’ is Controlled Flight Into Terrain. Again, not because something has broken, but because a crew have just totally lost their situational awareness. These account for 18% of all fatal accidents, and 7% of all losses reviewed in the 20 year period.

The Korean Air Flight 801 accident report offers more insight into how these occur.

Again, other things factor into this – distractions, visual illusions, somatographic illusions – and these can be tough to handle because they are one of the few things a simulator cannot realistically simulate.

We have backups though. GPWS for one. Although this really is the final layer of the safety net. If this is going off then you’re out of the prevention and well into the recovery and mitigation part of the accident curve.

There is good old Situational Awareness again though – this is the stuff of heroes. It is something you can gain, or regain, with a simple briefing. A “What if… then what will we do?” chat. Briefing threats is important, but briefing how to avoid them is even better. Get a bit of CRM in and ask the other person next to you what they think you should be looking out for.

Situation Awareness is knowing where you have told your plane to go but, most importantly, it is knowing if it is actually going there (and this means vertically and laterally).

3. Runway Excursions

These account for 16% of fatal accidents, and a whomping great 36% of hull losses. No failed brakes or issues with steering involved, just big old “oops, didn’t check the performance properly” type situations. We have mentioned this before. It is one of the biggest “that just shouldn’t have happened” types of event.

Actually, the biggest thing that leads up to runway excursions is generally unstabilised approaches.  These are something we can definitely avoid and IATA has some great tips on how. Cut out the unstabilised approaches and you’ll probably cut out a big proportion of runway excursions right away.

There are a few things to help us here too – if you are flying an Airbus then lucky you, because these have a great system on them called ROW/ROP that squawks at you on the approach, and on the landing roll, if it reckons you’re going to go off the runway. But if you don’t have this, then checking your performance properly and managing that approach well are going to be what saves you from an embarrassing call to your chief pilot.

There is also a big change to runway friction reporting coming in on 4th November 2021 – The Global Reporting Format, or ‘GRF’ as he is known to his friends. Griff will standardize how runway surface conditions are reported worldwide and with better reporting will hopefully come better awareness of the risks.

That was the Top 3. What about the others?

The other four are lumped together into ‘Other’ which makes up the remaining 33%. (Actually, 11% of that is ‘other’ others!) Combined, our final four account for 22% of all fatal accidents and 22% of hull losses.

These are:

  • Fire
  • Abnormal Runway Contact
  • System/Componet Failure or Malfunction
  • Undershoot/ Overshoot

Now, I know what you’re going to say – fire probably isn’t your fault (unless you dropped your phone under your pilot seat and then ran over it repeatedly with your chair trying to hook it out again).

But there are still things a pilot can do to help lower the impact of these.

How? Well, by knowing our fire procedures (the what to do if something Lithium Ion powered in the flight deck does start smoking), and by knowing the comms procedures needed to help support our cabin crew if there is something going on down the back. We can also prepare in flight – be ready with something in the secondary flight plan in case we need to suddenly divert.

As for system and component failures, well, the 737Max accidents of the last few years account for a big proportion of this, however, in all cases having a strong systems knowledge and preparing for those “what if?” situations might help save your life one day.

You might have noticed a shift in the training paradigm in the industry, and with good reason – the days of focusing on practicing specific failures in the sims are vanishing and in its place is Evidence Based Training – training that focuses on building the skills needed to handle any situation. If that all sounds newfangled to you then think of it this way – a pilot is there just not to push buttons, but to manage the flight, and these skills are the tools which will enable us to do that.

Fancy reading some more?

  • A full report from IATA on LOC-I can be found right here


SNOWTAMS slip into a new style

ICAO will be updating the format of SNOWTAMs later this year – the special issue Notams that deal with surface condition reports and contaminated runways. They have published updated guidance on how SNOWTAMs should be issued when the changes take effect on November 4, 2021.

Here’s a summary of what’s changing, what the new style SNOWTAM will look like, plus a handy chart to help you decode them…

The Friction Task Force

There is such a thing, and we can only assume they wear skintight suits and body surf down runways to measure the friction. Anyway, they make recommendations on global reporting formats and also how to assess runway surface conditions.

It is quite a big thing. A lot of accidents happen because runway friction is not reported correctly. Or rather, pilots don’t understand it/choose to ignore it. Just ask (several) crews flying into UEEE/Yakutsk about it.

But if you check out the RCAM (Runway Condition Assessment Matrix) below, you will notice that offering a braking action is the preferred method nowadays. Friction coefficients are not so useful.

What is a SNOWTAM?

It is a special series Notam that provides a surface condition report to let pilots know what is on the runway, how much of that is on the runway, and what they can expect their airplane to do (braking wise) on said runway.

So, it is something that basically tells the pilot: “Watch out, slippery!” in a rather complicated sort of way.

SNOWTAMS use metric units, and a bunch of codes for deciphering. More about that later on.

What are ICAO changing?

As of 4 November 2021, the maximum validity of a SNOWTAM will be 8 hours. Currently they are 24 hours and a lot can change in that time meaning you have to try and discover what is still valid and relevant and what is not.

With the new ones, if they don’t say anything different after 8 hours then you can assume the runway surface condition is good and normal again. If anything changes, they will release a new one which will automatically replace the old one.

Each SNOWTAM will get its own serial number for identifying it.

What else is in the Guidance?

TTAAiiii CCCC MMYYGGgg (BBB)

Yep, that is written in it. It is an abbreviated heading demonstrating how certain things should be written. For example:

This is an example of how the new style SNOWTAM will look. Not a huge difference to the old ones, but here is a decode for you anyway.

  • GG EAD etc etc is who produced it. Not super relevant for pilots.
  • Snowtam 0154 is the serial number of the Snowtam
  • EADD is where we get interested. That is the airport identifier. Issued on the 17th February at 0535
  • Runway 09L 
  • It then gives the runway condition code for each runway third, as determined by the RCAM (runway condition assessment matrix). 6/6/6/ means dry/dry/dry.
  • Next up is the percentage coverage. NR means less than 10% or dry. Hence the many NRs
  • This SNOWTAM then moves onto 09R because frankly 09L was quite boring and dry.
  • 09R is 5/2/2 (good, medium-poor, medium-poor according to RCAM). 100% covered, 50% covered, 50% covered) and NR/06/06 is the depth – dry/ 6mm/6mm of wet/Slush/Slush
  • Then it moves onto another runway…. blah blah blah

The last bit is another change – this gives you “Situational Awareness” – a free text (i.e. real human language) section reporting other important stuff you might want to know.

A decoding device

We aren’t going to be there to decode for you, so here is a decoding device we made earlier (by copying the ICAO one and adding some nice colours).

You might also want to download something like the SNOWTAM app on your smartphone (just make sure whatever you use is correct against your company manuals).

Why these changes?

Well, in order to make SNOWTAMS better, because they are fairly important. You might get some frosty toes if you step in a puddle of slushy snow, but you’re going to get more than cold feet if you go skidding off the end of a runway.

SNOWTAMs are there to make winter weather safer. They give critical information about the state of the runway, and this should be plugged into whatever performance calculating device your airplane needs you to use so that you can see whether you will stop before, or after, the end of the runway.