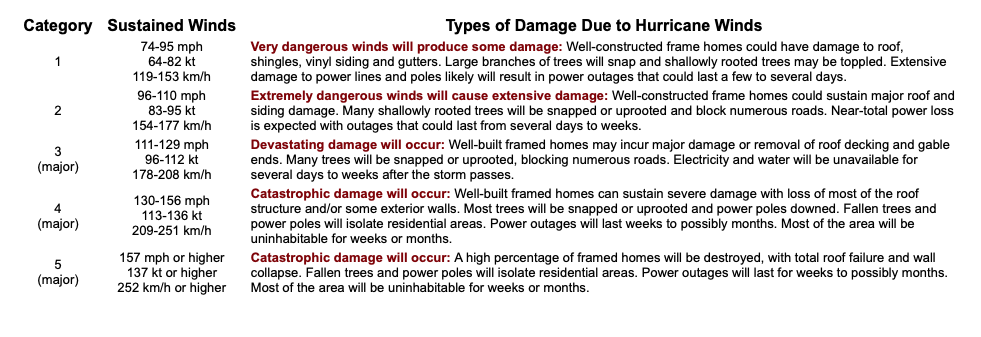
SE Asia Monsoon Season: What Are LSWDs and Why Will They Cost You Fuel?

June marks the start of monsoon season throughout Southeast Asia. From now until October, enroute weather deviations will routinely exceed 100nm.

This creates a significant challenge for controllers and coordination between the high number of FIRs that span congested air corridors between Taiwan, Hong Kong, Singapore and Indonesia.

To make matters worse, the 2024 Monsoon season is predicted to be a bad one.

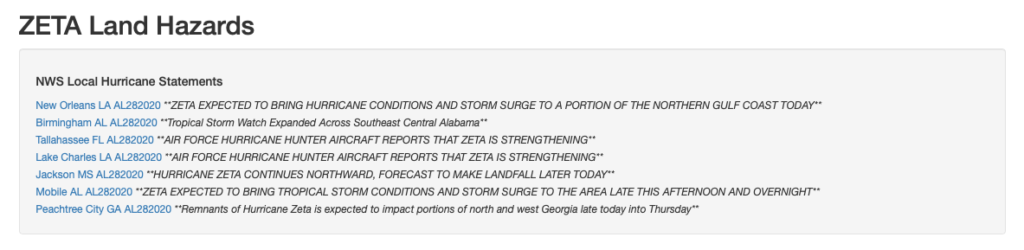
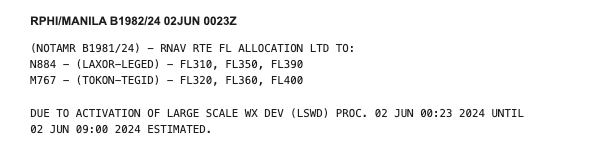
And so, the answer is something called Large Scale Weather Deviation Procedures (LSWD) already innocuously appearing in FIR Notams like the one below.

This raises two important questions:

  • What does LSWD actually mean?
  • What are operators doing about it?

In a nutshell, your standard contingency allowance may no longer be enough – meaning unfamiliar operators (especially on fuel critical routes) may unexpectedly be caught with their pants down.

So, let’s take a closer look.

The 2024 monsoon season is going to be bad.

The clever folk at the World Meteorological Organization recently said so.

Last year, in comparison, was weak.

You can take a look at their full report here, but the short story is that thanks to a spicy combination of ‘ninas and ninos’ much of Southeast Asia is about to receive up to ninety percent of its annual rainfall in the next few months. Which means large scale build-ups will be everywhere.

The airspace picture.

Spanning this area of unstable weather is a large number of adjacent FIRs serving some of the busiest air corridors in the world.

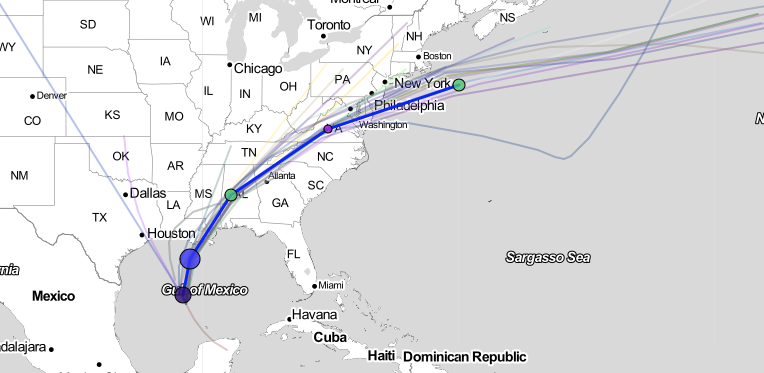
Take this routing (WADD/Bali to VHHH/Hong Kong) as an example, overlaid with current precipitation in the region. It’s very early days, but you can already begin to see the extent of the deviations FIRs are dealing with.

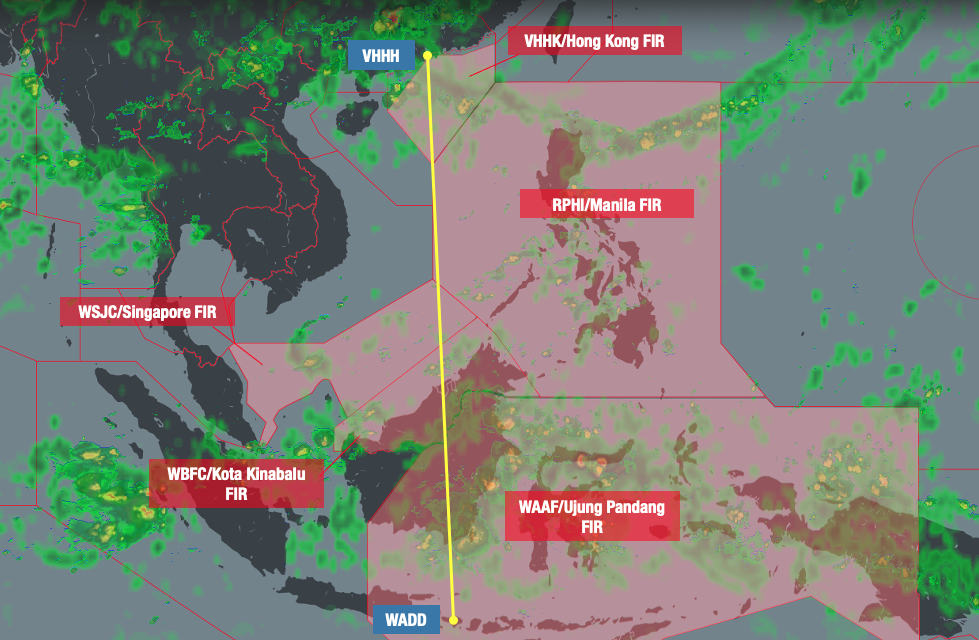
The sheer scale of weather deviations required by aircraft in this area creates a major challenge for air traffic control.

The lateral separation between adjacent airways is often far less than the deviation each aircraft will require, along with the narrower vertical margins of RVSM airspace.

This creates numerous problems for controllers – providing priority handling to one aircraft creates delays and disruptions for others. It’s your standard ripple effect.

To create room, ATC has specific protocols to manage these deviations. They call them LSWDs and they are used to reign in the mess.

How do these procedures work?

Traffic will be processed through a limited number of routes with level restrictions bound by their direction of flight. These routes can be found in each state’s respective AIPs.

Here’s an example found buried in Singapore’s docs:

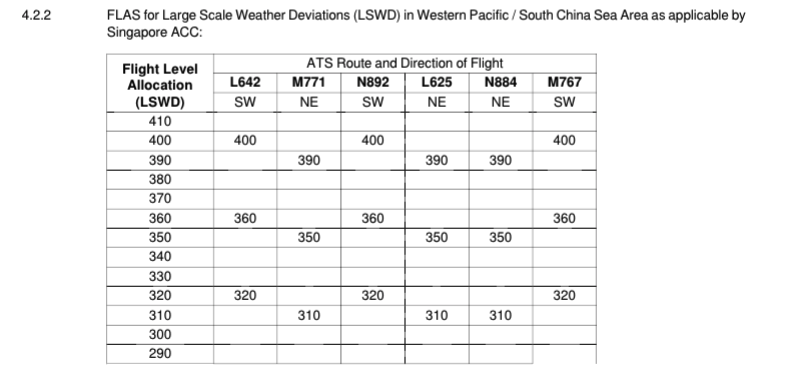
To make co-ordination easier between the numerous ATS sectors, all traffic operates with the same level availability whenever LSWDs are active.

For business jets, this may become problematic as higher flight levels (FL400+) may not be available for extended periods of time.

As a locally-based G550 Captain explains:

“Even if higher flight levels are available in one FIR, controllers may be reluctant to give them to you. This is because there is no guarantee that the next sector can accommodate it and it can be hard to get you down again…

 …The main thing with LSWD is knowing that a lot of levels we usually get won’t be available. And so, we carry more fuel accordingly. It may also be worth briefing the pax that conditions may be bumpier than they’re used to…”

Flow control and crossing time restrictions are also common which may mean the use of less efficient mach numbers.

This can also lead to delays for start-up clearances due to enroute spacing. When asked what additional fuel our local G550 Captain carries for these procedures, his answer was this – “at least thirty minutes.”

Have more to add?

Local operator feedback is invaluable to everyone in the group. If you’ve got anything to add to this article, get in touch with us at team@ops.group


Microbursts: The clouds are gonna get ya!

Microbursts! These short-lived, intense downdrafts of air will try their best to wreck your takeoffs and landings completely. But how do they work? And how can we avoid them?

What are microbursts exactly?

Microbursts are atmospheric marvels characterised by sudden, powerful air downdrafts that spread horizontally when they reach the ground. They are often associated with severe thunderstorms, convective clouds, or other intense weather systems. These downdrafts can reach up to 130 knots, creating hazardous conditions for aircraft.

Double Danger

Microbursts pose a significant threat to aircraft. Two main reasons:

  1. The powerful downward airflow. This can cause an aircraft to lose altitude or rapidly experience significant changes in airspeed. No matter how much power your engines produce, you won’t out-climb these downdrafts!
  2. The horizontal outflow of air when the microburst reaches the ground. This is known as the “outflow boundary” and can create strong crosswinds that affect the aircraft’s handling and control. When pilots get caught in these crosswinds, they will likely struggle to maintain the desired flight path, increasing the risk of accidents. Remember, the strength of the microburst will probably mean that the aircraft cannot outperform it – even with a max rate of climb, you will be unable to get a positive performance of the plane (Aeromexico Flight 2431 is an example of what can happen if you try to fly through a microburst).

How do we avoid them?

  1. Weather checks! Stay informed about weather conditions. Modern weather forecasting tools, including onboard radar systems (such as PWS – Predictive Windshear System) and real-time weather updates (often relying on the tower or a ground observer), provide valuable insights into severe weather systems that may produce microbursts. Review weather reports and forecasts before each flight, and pay close attention to thunderstorm activity and associated weather patterns.
  2. More training! Pilots should receive solid training on recognising and responding to microbursts during their initial flight training and beyond. This training should include familiarising with microbursts’ visual cues, such as dark and ominous cloud formations, heavy precipitation, and sudden wind shifts. But you should also be trained in specific techniques for mitigating the effects of microbursts, such as proper recovery techniques and decision-making during critical flight phases.
  3. Talk to ATC! Maintaining open lines of communication with AT is vital in avoiding microbursts. ATC can provide pilots with up-to-date weather information and may offer alternate routes or hold patterns to prevent known or suspected microburst activity.
  4. Eyes like a hawk! During the flight, regularly check onboard weather radar systems, which can detect the presence of microbursts. If a potential microburst is seen somewhere, avoid the area: this might involve altering the course, requesting a change in altitude, or holding until the microburst dissipates. Remember that if you see Virga, there is a good chance that a microburst may form.
  5. Just avoid them! Obviously the best mitigation strategy! They will form quickly but dissipate quite quickly as well. Holding and waiting for a clear weather path is critical to a safe approach and landing.

A good rule of thumb to keep you safe when it comes to these beasts = 5nm for 5min. In other words, stay more than 5 miles away and wait at least 5 minutes from the last activity report.


What’s the delay in the USA?

We took a look at the stats the FAA publish about on-time performance to find out what the most common causes of delays are, which airports are worst affected, and what we can do to manage it.

On your marks…

First up, what counts as a delay? Your airline or operator might be a bit stricter on this, but the FAA consider a flight delayed if it arrives more than 15 minutes late. Which is probably what your passengers really care about as well.

The FAA gather their info from a bunch of carriers, and break it all down into five basic categories of delay:

  • Air Carrier: This is something under the airline’s control like crewing, maintenance type issues. So that time you wanted a Starbucks coffee and the queue was really long and you held the flight up.
  • Extreme Weather: We are talking the big, bad stuff like hurricanes, blizzards, tornadoes… the things that shut airports for hours.
  • National Aviation System: This is pretty broad and covers ATC, airport ops, high traffic volume sorts of situations. They also throw general weather into this (the stuff that airplanes and ATC should be able to deal with).
  • Late-arriving aircraft: A knock on effect from a previous flight delay.
  • Security: Broken X-ray machines, long queues because of that passenger who thought he could sneak a tiger on in his hand luggage type scenarios.

Pick a month

Here come the statistics…

In January 2021, 89.16% of flights were on time – which ain’t bad, but ain’t great. So, of the remaining 10.84%, what were the reasons for the delay?

Air Carrier Delays are the big offender, checking in at 3.63%. The airlines only have themselves to blame…

Although, NAS came in a close second with 3.6%.

Then there was the knock-on effect of one late flight making the next flight late. This accounted for 1.94% of delays, with 1.17% because of previous cancellations and diversions.

Extreme weather came in at just 0.46%, while security delays only resulted in 0.04% (probably because those passengers were just left behind).

Weathering the delays

Weather only accounts for 4% of delays, which might seem low, but remember we are talking ‘extreme weather’. Non-extreme weather should be manageable which is why “normal weather” causing delays falls under NAS.

If we dig a bit deeper and take a snapshot look at a random month (we picked May 2019 because everything was fairly normal back then), then weather was the reason for 65.62% of NAS delays. That is a whopping 27,864 delayed flights or 1,822,469 minutes.

Which airport is the worst?

Let’s take a look at the airports to look out for.

KDFW/Dallas Fort Worth in Texas. A check of all the 29 major US airports in Jan 2021, and Dallas was the only one coming in with an on time performance below 80%.

10.48% of KDFW’s delays were down to NAS. But let’s not be too quick to tell off ATC yet. Just under 21% was due to high volumes of traffic. Just under 31% was because of runway closures and a whopping 45% was due to nasty weather (major winter storms).

The runners-up for worst delays were KORD/Chicago and KFLL/Fort Lauderdale which came in at 84.58% and 86.44% respectively. Fort Lauderdale’s NAS accounted for just over 6% and 8% was because of traffic volume problems.

Stop boring me with statistics

OK, that is enough facts and figures. What are we really talking here? Well, the two biggies are the Air Carrier delays and delays from NAS (most of which seem to boil down to weather).

Bad weather means a backlog of traffic, often a lot of detour requests to manage, or diversions to support and this means a much higher workload for our ATC colleagues to try and deal with. Even when it is “just” rain, or a windy day, this leads to delays. We can’t change the weather, but we can plan for it.

Delays are not just a cost and customer service issue – they are also a big fuel consideration…

So what can we do about them?

  • Check the forecasts. Planning for those delays in advance is a good idea because chances are they are going to result in some long holds, and long holds need fuel. Don’t just think about your destination weather – have a look at the alternates as well because when one airport shuts because of weather, others nearby probably will as well. If they don’t, then they are going to fill up fairly fast with diverting traffic.
  • Check the peak times. If you are not a scheduled carrier then try to plan your flights to head in at non-peak times to avoid high traffic volume delays.
  • En-route stuff. If you are delayed out of somewhere then you can try and make that time up en-route. Speeding up might seem like a good plan, but in reality unless you’re talking a mega long flight this probably isn’t going to make a huge difference to your time (but probably will to your fuel burn). Asking for directs however, is a good way to chop the time down.
  • Check the schedule. If you depart late then check your schedule time. With a decent tailwind you might find your flight time still brings you in early in which you don’t want to go speeding up and then find yourself having to wait for a parking spot
  • Winter planning. Winter (de-icing) is probably the biggest cause of delays out so get those calls in early if you need to de-ice and plan ahead.

On-time performance is great, but sometimes delays are just unavoidable. So while we can all “think on time” a bit more, thinking about safety (and not rushing) is still the best mentality any pilot can have.


2020: A Record Breaking Hurricane Season

It has been a record breaking season for the Hurricanes. We are not talking the Carolina based NHL team. We are talking actual hurricanes.

2020 has now tied with 2005 as the most active hurricane season in history. No surprise there given what’s gone on in 2020 so far.

Hurricane Zeta became the 11th hurricane of the year. It is also the earliest in a season that 27 storms have needed naming (2005’s Zeta only formed at the end of November).

2005 is still (thankfully) beating 2020 in terms of major hurricanes.

What is the difference?

‘Hurricane’ comes from an old world which means ‘god of the storm’. ‘Typhoon’ comes from the beast Typhon – a Greek monster who fathered the sphinx, Cerberus and the super lion Nemean that Hercules had to kill. The etymology of the world ‘Cyclone’ is less terrifying, but they all boil down to the same thing – 

They are fancy terms for great, big, mess-making, flash-booming, horror storms. Whether it is a Hurricane, a Cyclone, or a Typhoon just comes down to where in the world it is wreaking havoc.

Hurricanes, Cyclones, Typhoons also get individual names if they get big enough. Some of these names get retired if they cause too much damage and destruction – like Katrina in 2005.

A full list of Hurricane names can be found here.

So, what are they?

They are “large-scale, atmospheric wind-and-pressure systems characterised by a low pressure at the centre, and by a circulating wind motion”. They spin counterclockwise in the Northern Hemisphere, and clockwise in the Southern Hemisphere.

Buys-Ballot famously stated if you stand with your back to the wind in the Northern Hemisphere then the low pressure will be to your left. I wouldn’t recommend standing with your back to a Hurricane though.

These storms only get classified as a Storm if the tropical depression they form from gets mean enough – basically, winds exceeding 39 mph. If the storm’s winds exceed 74 mph it gets reclassified as a Hurricane.

Hurricane’s also get classified from 1-5 based on their capacity for damaging things.

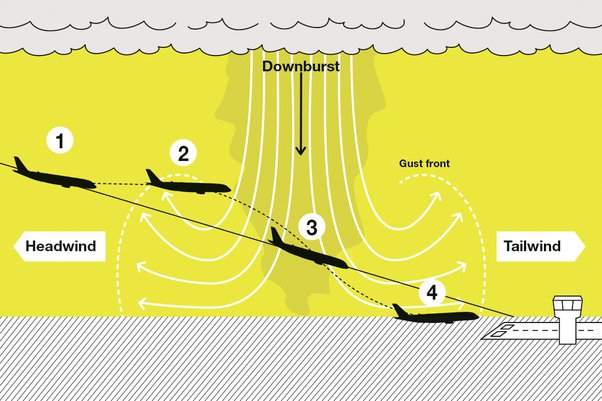
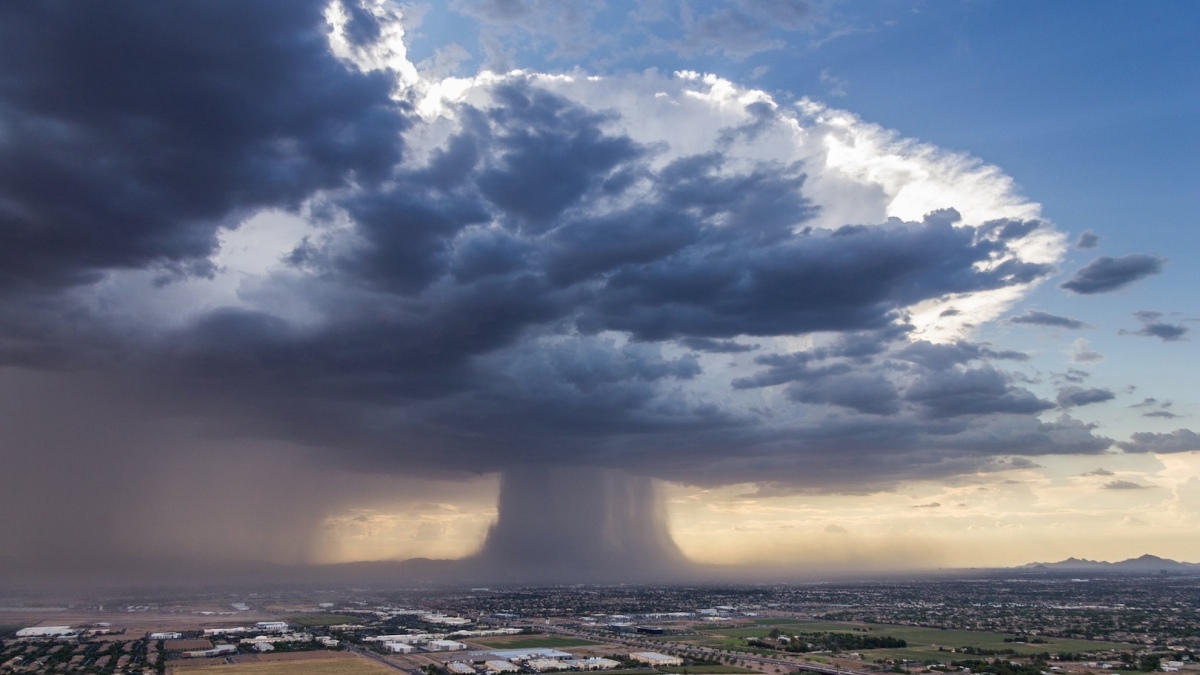
Why does aviation hate them?

Well, mainly because of the weather they bring. The crazy winds, serious rainfall and flooding, and power outages they cause.

How can we avoid them?

Meteorology departments track storms and try to forecast their movement. Some of the movement is based on air currents and sea currents (because hot water feeds them) amongst other things. From this they can create what are called Spaghetti models which help forecast where the storm will travel.

Agencies such as NOAA also (on purpose) fly airplanes into them. These Lockheed WP-3D Orion aircraft have 4 turboprops and are pimped out with probes for measuring every wind and pressure change to help scientists see what is going on inside. 

Little salute to the pilots who do those flights!

These aircraft measure everything! They have radars which can scan the storm vertically and horizontally, and can even drop probes to test the water temperature.

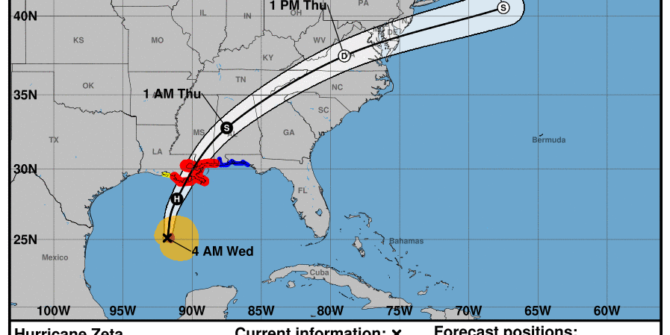
Satellites monitor storms as well, but mainly just send down horrifying photos of how massive they are.

All this information gets fed to sites, some of which we monitor…

What do we tell you?

We check a site called Cyclocane which tells us about active tropical storms, and their forecast paths. We try to give an alert about severe weather forecasts, and alerts on airports that are cancelling operations due to weather.

We also check other weather forecast sites, and NOAA for warnings on serious weather which might affect operations.

Zeta…

Zeta is a serious storm. Still currently over the water, it is strengthening and is expected to bring storm surges and extreme winds of over 100 mph

There are storm surge, tidal and hurricane warnings in place for Florida and Louisiana.

It is expected to turn North on October 28 or 29, and is expected to make land fall close to New Orleans late in the evening of October 28


The mystery of the missing Russian Weather

A little while ago, Russia stopped sending out METAR and TAF weather updates on the international wires for a whole bunch of airports.

This made life difficult for international operators, especially airlines and business jet operators that use Siberian alternates. If you don’t have the weather reports, you can’t use it.

In OpsGroup, one of our members reported that they now had issues getting weather for places like
UHHH/UHMA/UHMM/UHPP/UIBB/UIII/ULAA/ULLI/UNAA/UNKL/UNNT/USCC/USNN.

Then, another member pointed us at this official site – http://metavia2.ru/index.php?lng=en. But to register, you need to send an email, and nobody got replies.

So, the mystery remains unsolved. What do you know? Comment below, or email us at bulletin@fsbureau.org.


A different map: Winter Storm

Apart from the routine Flight Operations that we support at the Flight Service Bureau, we spend a fair bit of time building new things.  Much of time, those things involve maps, and so we keep our eyes out for new ideas … and we especially liked this graphic presentation of US Winter Storm Jonas at the end of January 2016.

We took the original and slowed it down a little, but what you’ll see here is forecast data from NOAA’s High Resolution Rapid Refresh Model to animate the storm’s arrival in the Mid-Atlantic. The map shows water equivalent accumulated snow depth, or WEASD, which we can think of as the volume of water contained in the snow on the ground.

JonasMap