Who is Eddie? And what does he have to do with turbulence?

The other day, before another oceanic crossing, I settled in to brief myself on that afternoon’s flight plan.

As I scalded my mouth with a hastily purchased airport coffee and began to peruse the carefully collated collection of fuel burns and leg times, my eyes fell upon the dispatcher’s remarks. As I stared, the following note stared right back at me…

“Sorry guys, unavoidable EDR 60 at TOC…”

Apology accepted. But what on earth is EDR 60?

With the weight of the braid on my shoulder, multiplied by a factor of my stupidity as a proficient but highly ‘human’ aviator, I realised I needed to call in the big guns – this was a job for Google.

A powerful blankness ensued as I surveyed the answer… Eddy Dissipation Rate. The official metric of ICAO and World Met Organization turbulence reporting since I was in high school. Had I been living in a cave?

This thing mattered, and so I needed to dig deeper.

Here’s what I found out:

…it’s an aircraft-independent meteorological field expressed in meters squared per second cubed…

Not helpful. I read on…

…the cube root of the dissipation rate of turbulent kinetic energy…

I took another sip of coffee. I didn’t have time for this.

Sign-on was approaching, along with hundreds of passengers expecting me to protect them from this ‘EDR 60′ with my big fancy license. All I knew was that it meant bumps. Clearly, I needed to get a better grasp on this.

If you already know what EDR is, and could explain it to me on a napkin, there’s no need to read on. If you’re ‘asking for a friend,’ here is a crash course, written in human.

The Simplest Answer

You don’t need to cube anything. Except maybe the confidence you lost (like me) in not knowing what an EDR is. It’s pretty simple (ignoring the arithmetic of measuring it).

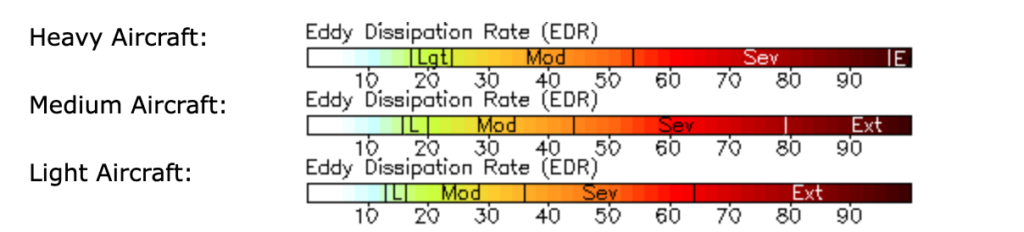
The higher the number, the more intense clear air turbulence may be…if you encounter it.  Anything over 50 may result in moderate to severe CAT.

But that interpretation also depends on the type of aircraft you are flying.

So, there may be some nasty stuff around. But if you want to get your head around it, you’ll need to dig a little deeper.

So, let’s dig…

When we talk about turbulence, we refer to light, moderate, severe, and extreme. We attempt to categorise these with useful definitions like ‘loss of control.’

The problem is that it is quite challenging to quantify the severity of CAT concerning different aircraft types – what’s bad in a 152, may not be as bad in a Gulfstream. It varies from aeroplane to aeroplane, and forecasters don’t know what equipment you operate.

This is where EDR comes into it – it doesn’t cares about what aircraft you fly. It is just a measure of something.

An eddy is simply the swirling of fluid. And air behaves like a fluid. A turbulent atmosphere will make these eddies disappear quicker. A calmer one will allow them to persist.

So, if we know what is happening to these eddies, it can give us an indication of how ‘churny’ the atmosphere is, along with a healthy dose of mathematics, of course.

Eddies dissipate quickly = a turbulent atmosphere.

An EDR is measured with a value of between 0 and 1. But seeing a value of 0.4 for instance, doesn’t exactly leap off the page of your flight plan.

So, we multiply it by a factor of 100 to make it easier to use.

Cool, we’re almost there…

One size doesn’t fit all

Once we have an EDR, we must know what to do with it.

As mentioned, every aircraft is different and will respond differently to turbulence. This is where weight begins to matter.

An EDR of 20 might produce moderate turbulence for a King Air, but gently shake the champagne glasses of an A380 and nothing more.

The clever folk at the National Center for Atmospheric Research, therefore did a study and came up with three weight classes to help you understand an EDR:

Where do I find this EDR?

Many non-airline folk don’t have the luxury of a friendly dispatcher like I had.

But you can quickly look it up. Better yet, it is as simple as paint by numbers (if you know what to do with the answer).

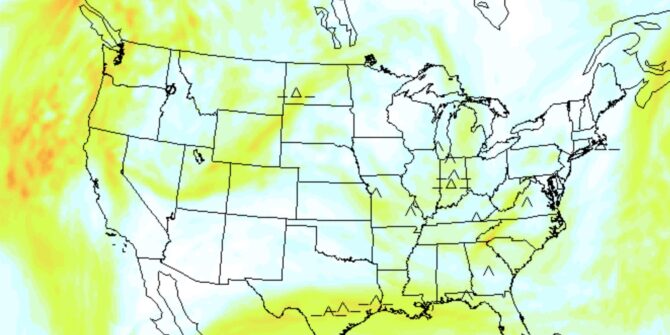
It would help if you had GTG (graphical turbulence guidance) like the one below. And the colours change depending on how heavy your aeroplane is.

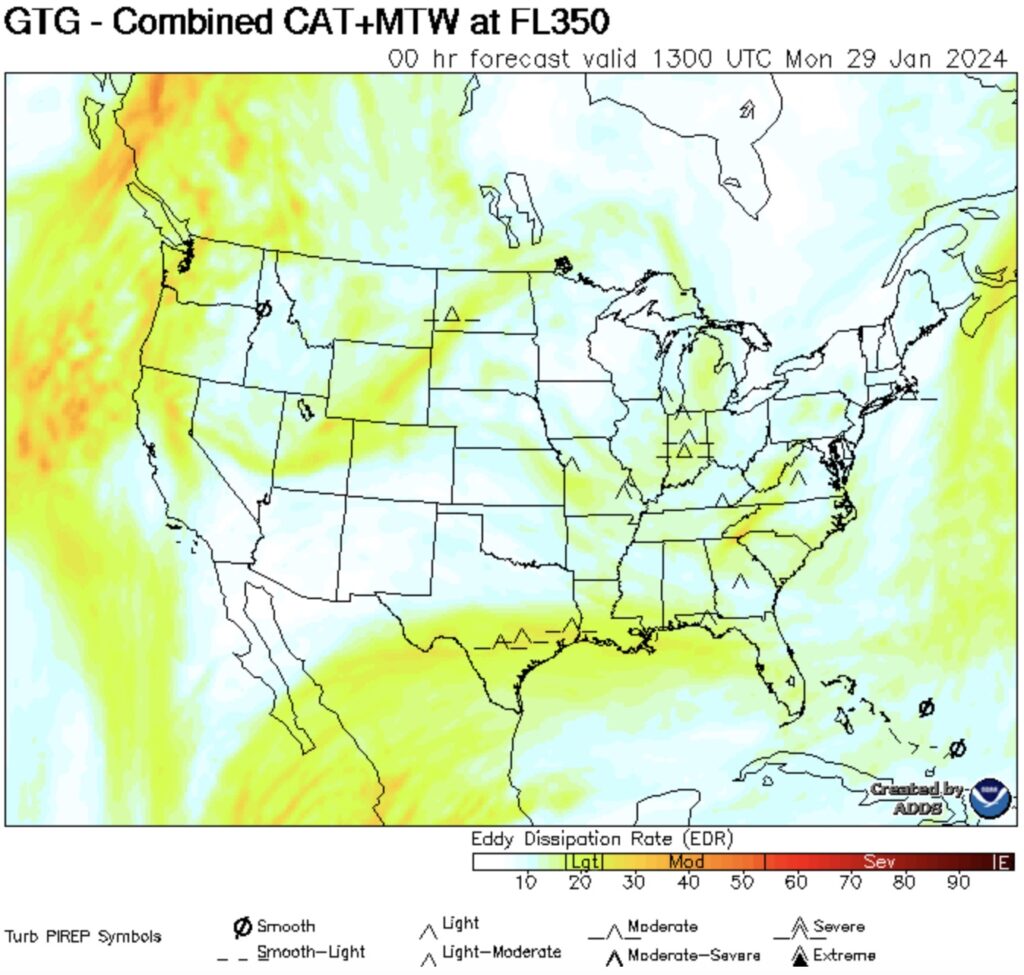
The NOAA’s example of a GTG chart (graphical turbulence guidance).

Better yet, the way EDRs are presented can be changed. For instance, cross-sections of a route can also give pilots a good indication of the smoothest levels.

Check out the NOAA website here.


Cow Farts and Aviation

Did you know that cow farts are one of the major contributors to global warming?

Go ahead – google it. Just know that your search history will take some explaining later.

In fact they account for eighteen percent of the problem. They’re flatulent creatures, and their trouser coughs contain methane gas which is almost one hundred times more powerful at trapping heat than good ol’ carbon dioxide. In fact their flatulence is so strong, it can cause acid rain. Umbrella anyone?

Why are you reading this on an aviation website? Fair question.

Because regardless of where you stand on the cause of global warming, we know for a fact that the earth is heating up. And aviation is poised to be one of the victims.

Let me explain.

Bumpy Road

As the earth warms, jet streams will become stronger – along with wind shear. As we hitch a ride on those long routes eastbound, clear air turbulence is set to become much more frequent, and much more dangerous.

They’ve done studies, you know – and those jet streams are already fifteen percent more sheary than they were back in the 70s. And things are accelerating.

The bottom line is this: scientists believe there is going to be two to three times as much severe turbulence in the next few decade thanks to cow farts (and of course all other contributing factors).

How severe is severe?

We’re not talking light chop.

There are two levels of turbulence we’re most concerned with. The first is severe – essentially large and abrupt changes in altitude or attitude. Your aircraft may even be out of control momentarily.

Beyond that turbulence can also be extreme. It doesn’t make for pleasant reading, but the official definition is when the aircraft is violently tossed about and almost impossible to control. You may even take damage.

Both are nasty.


What does this mean for ops?

Perhaps the most at risk are flight attendants. The NTSB reckons they are twenty-four more times more vulnerable to injury from CAT than their passengers. They account for eighty percent of all turbulence related injuries. This make sense as they are often on their feet, pushing carts that can weigh upwards of 300lbs.

Here’s another startling statistic – between 2009 and 2018, in almost thirty percent of turbulence related incidents, there was no warning.

CAT is the enemy you cannot see, because it mostly happens in clear air. It isn’t associated with storms or clouds, and weather radars need moisture to work. Our eyes are useless too.

Granted, planes aren’t about to start falling from the sky. But we can expect the amount of time spent in turbulent conditions on an average flight across the Atlantic to exceed thirty minutes in the years to come. Darn cows.

Great, what can we do about it?

Actually three things. Protect your crew, predict where it will happen, and care about sustainability. Let’s dig a little deeper.

Crew

The absolute best way to protect everyone on board during CAT is to have them seated with their belts on. The head of a major flight attendant union is calling for changes. It is becoming increasingly dangerous for them to still be on their feet, while passengers are strapped in.

The NTSB agrees and is recommending more stringent rules when those seatbelt signs turn on – especially for crew. The notion is a seat for everyone – including infants and young children who may be sitting on an adult’s lap and riding gratis.

While it may feel reassuring that all pax are safely seated, don’t underestimate how at risk cabin crew are if they are still up and working.

Spotting the stuff.

Predicting CAT isn’t an exact science, and this ain’t no met class. But in a nutshell it is caused due to the difference of speed at high altitude (usually well above FL150) when flying near the boundary of two air masses.

Jet streams are typically strongest in colder months, and weaker in warmer ones.

Two things to look out for: dramatic changes in temperature, and dramatic changes to wind speed and direction.

Both are tell tale signs of CAT.

Along with that information in your flight plan, shear rates, sig wx charts and pilot reports (pireps) are also valuable sources of information.

Likewise, if you find some let ATC (and the traffic around you) know.

There are also turbulence information sharing platforms available to crew which provide real time updates on where the rough air is.

Sustainability

There is a lot of noise at the moment about sustainability, alternative fuels and ‘net carbon zero.’ It can all get a little dry.

But it is the operational impact of global warming that is really going to matter to us on a day to day basis, which is why we need to care. More than numbers.

Asides from clear air turbulence, as the jets grow stronger, westbound flights will take longer, burn more fuel and cost more. Not to mention more time away from being poolside at the Holiday Inn.

Then there’s the sea level. It is rising as the polar ice cubes melt. One study suggested by 2100, one hundred airports around the world will be below sea level, and close to half a thousand will be at serious risk of flooding and storm surges unless things change  – affecting up to twenty percent of all routes. That’s a lot of water.

Where to from here?

The cows aren’t about to stop farting, so we need to mitigate. This may mean spending more time and attention on the risk that clear air turbulence poses while we flirt with the time saving benefits of the world’s jet streams on a daily basis.

We can also support the overall industry push to operate cleaner in the long run. A great no-nonsense source to keep track of these industry trends are IATA updates – you can view those here.